
We'll build your
We'll build your
We'll build your
We'll build your
Automation and AI Agents
Automation and AI Agents
Automation and AI Agents
Automation and AI Agents
Describe your process, and we’ll build you a fully functional AI Agent or automation using our 2500+ pre-built bots—live within 24 hours.
Trusted by industry leaders like


Automate in < 24 hours
Leverage our extensive library of thousands pre-built bots, connectors, and templates to launch your automation workflows in less than a day.
Automate for < $1000
Reduce costs with our one-time workflow setup fees starting at $1000. After that, pay only for what you use with our transaction-based pricing.

Deploy AI + RPA + OCR + Humans
Solve your automation needs with AI bots, API connectors, document automation, RPA, and human-in-the-loop capabilities all in one place.
Automate in < 24 hours
Leverage our extensive library of thousands pre-built bots, connectors, and templates to launch your automation workflows in less than a day.
Automate for < $1000
Reduce costs with our one-time workflow setup fees starting at $1000. After that, pay only for what you use with our transaction-based pricing.
Deploy AI + RPA + OCR + Humans
Solve your automation needs with AI bots, API connectors, document automation, RPA, and human-in-the-loop capabilities all in one place.
Digitally transform your business with Wrk
Digitally transform your business with Wrk
Digitally transform your business with Wrk
Digitally transform your business with Wrk
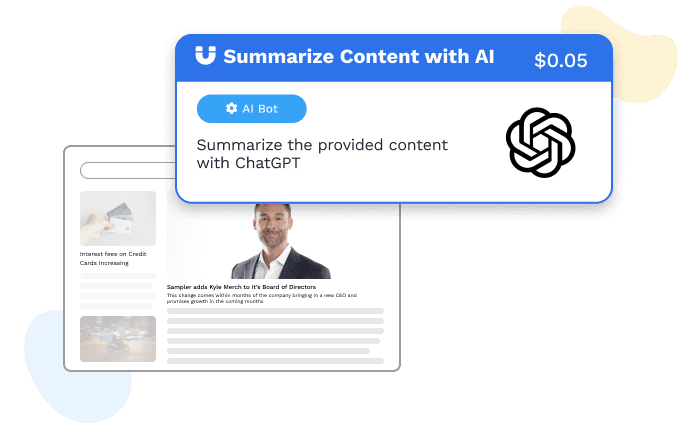
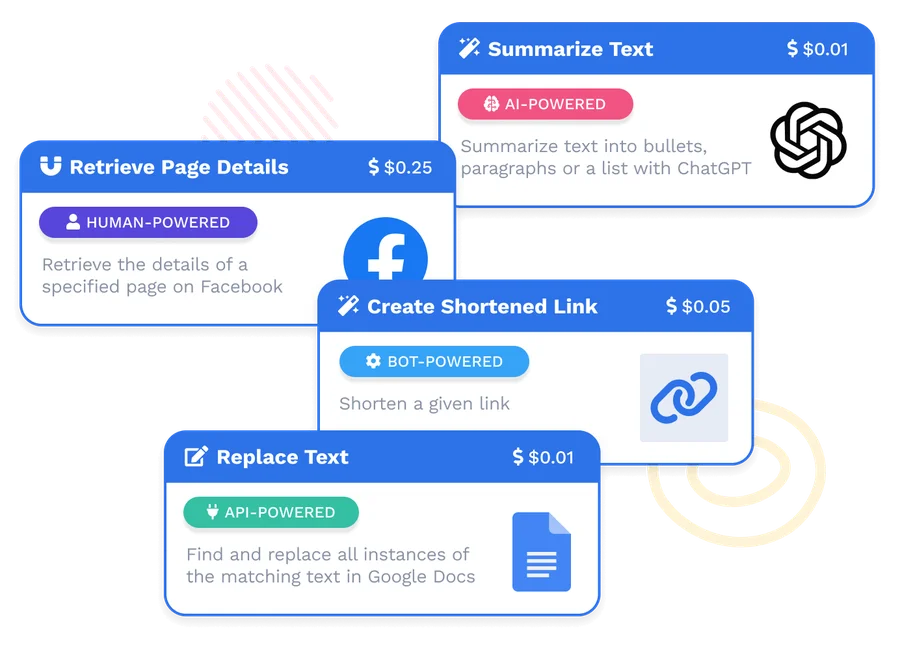
AI Bots
Integrate intelligence like ChatGPT and Anthropic AI into your workflows to automate complex tasks & enhance decision-making within your automation processes.
AI Bots
Integrate intelligence like ChatGPT and Anthropic AI into your workflows to automate complex tasks & enhance decision-making within your automation processes.
AI Bots
Integrate intelligence like ChatGPT and Anthropic AI into your workflows to automate complex tasks & enhance decision-making within your automation processes.
AI Bots
Integrate intelligence like ChatGPT and Anthropic AI into your workflows to automate complex tasks & enhance decision-making within your automation processes.

API Connectors
Seamlessly connect your favorite applications like Salesforce, Slack, and Microsoft 365 into your workflows to streamline data flow and unify your business processes in real time.
API Connectors
Seamlessly connect your favorite applications like Salesforce, Slack, and Microsoft 365 into your workflows to streamline data flow and unify your business processes in real time.
API Connectors
Seamlessly connect your favorite applications like Salesforce, Slack, and Microsoft 365 into your workflows to streamline data flow and unify your business processes in real time.
API Connectors
Seamlessly connect your favorite applications like Salesforce, Slack, and Microsoft 365 into your workflows to streamline data flow and unify your business processes in real time.
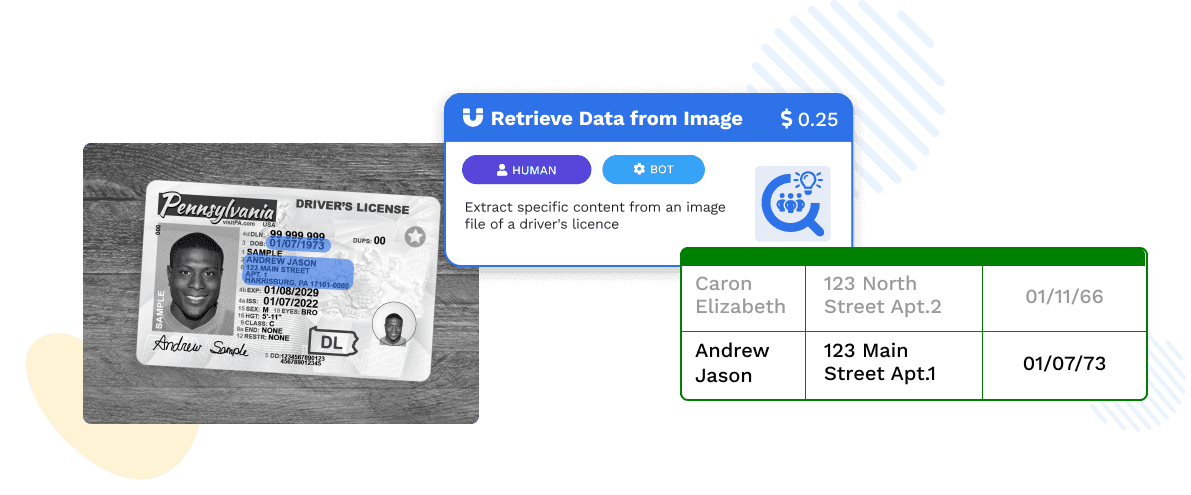
OCR & Document Automation
Automate document processing with advanced tools like Adobe Sign and DocuSign integrated into your workflows. Leverage AI-powered data extraction and OCR technology to handle contracts, invoices, and forms with minimal manual intervention.
OCR & Document Automation
Automate document processing with advanced tools like Adobe Sign and DocuSign integrated into your workflows. Leverage AI-powered data extraction and OCR technology to handle contracts, invoices, and forms with minimal manual intervention.
OCR & Document Automation
Automate document processing with advanced tools like Adobe Sign and DocuSign integrated into your workflows. Leverage AI-powered data extraction and OCR technology to handle contracts, invoices, and forms with minimal manual intervention.
OCR & Document Automation
Automate document processing with advanced tools like Adobe Sign and DocuSign integrated into your workflows. Leverage AI-powered data extraction and OCR technology to handle contracts, invoices, and forms with minimal manual intervention.
RPA + Human-in-the-loop
Combine the power of Robotic Process Automation (RPA) with human expertise. Automate repetitive tasks and incorporate human decision-making where it’s needed most to ensure quality, compliance, and effective exception handling.
RPA + Human-in-the-loop
Combine the power of Robotic Process Automation (RPA) with human expertise. Automate repetitive tasks and incorporate human decision-making where it’s needed most to ensure quality, compliance, and effective exception handling.
RPA + Human-in-the-loop
Combine the power of Robotic Process Automation (RPA) with human expertise. Automate repetitive tasks and incorporate human decision-making where it’s needed most to ensure quality, compliance, and effective exception handling.
RPA + Human-in-the-loop
Combine the power of Robotic Process Automation (RPA) with human expertise. Automate repetitive tasks and incorporate human decision-making where it’s needed most to ensure quality, compliance, and effective exception handling.
SOC 2 Type II certified
Wrk is SOC 2 Type II compliant, ensuring the highest standards of security, availability, and confidentiality for your data.
SOC 2 Type II certified
Wrk is SOC 2 Type II compliant, ensuring the highest standards of security, availability, and confidentiality for your data.
SOC 2 Type II certified
Wrk is SOC 2 Type II compliant, ensuring the highest standards of security, availability, and confidentiality for your data.
SOC 2 Type II certified
Wrk is SOC 2 Type II compliant, ensuring the highest standards of security, availability, and confidentiality for your data.

HIPPA/PIPEDA Compliant
Wrk is HIPAA & PIPEDA compliant, safeguarding protected health information (PHI) to meet stringent healthcare regulations and protect patient privacy.
HIPPA/PIPEDA Compliant
Wrk is HIPAA & PIPEDA compliant, safeguarding protected health information (PHI) to meet stringent healthcare regulations and protect patient privacy.
HIPPA/PIPEDA Compliant
Wrk is HIPAA & PIPEDA compliant, safeguarding protected health information (PHI) to meet stringent healthcare regulations and protect patient privacy.
HIPPA/PIPEDA Compliant
Wrk is HIPAA & PIPEDA compliant, safeguarding protected health information (PHI) to meet stringent healthcare regulations and protect patient privacy.

Managed Services
Let wrk’s team of automation experts build and manage your automation solutions, so you can focus on what matters most.
Managed Services
Let wrk’s team of automation experts build and manage your automation solutions, so you can focus on what matters most.
Managed Services
Let wrk’s team of automation experts build and manage your automation solutions, so you can focus on what matters most.
Managed Services
Let wrk’s team of automation experts build and manage your automation solutions, so you can focus on what matters most.
Use Case
Effortless Intent Based Lead Generation at Scale
Consume intent data on a daily basis and extract leads
HOW WE SOLVED IT FOR THIS CLIENT
100s of fresh leads
every dayChallenges
Time consuming
Our client’s marketing team was manually gathering leadsInefficiency
A lot of time was spent filtering and searching for relevant leads from the data
Scalability Issues
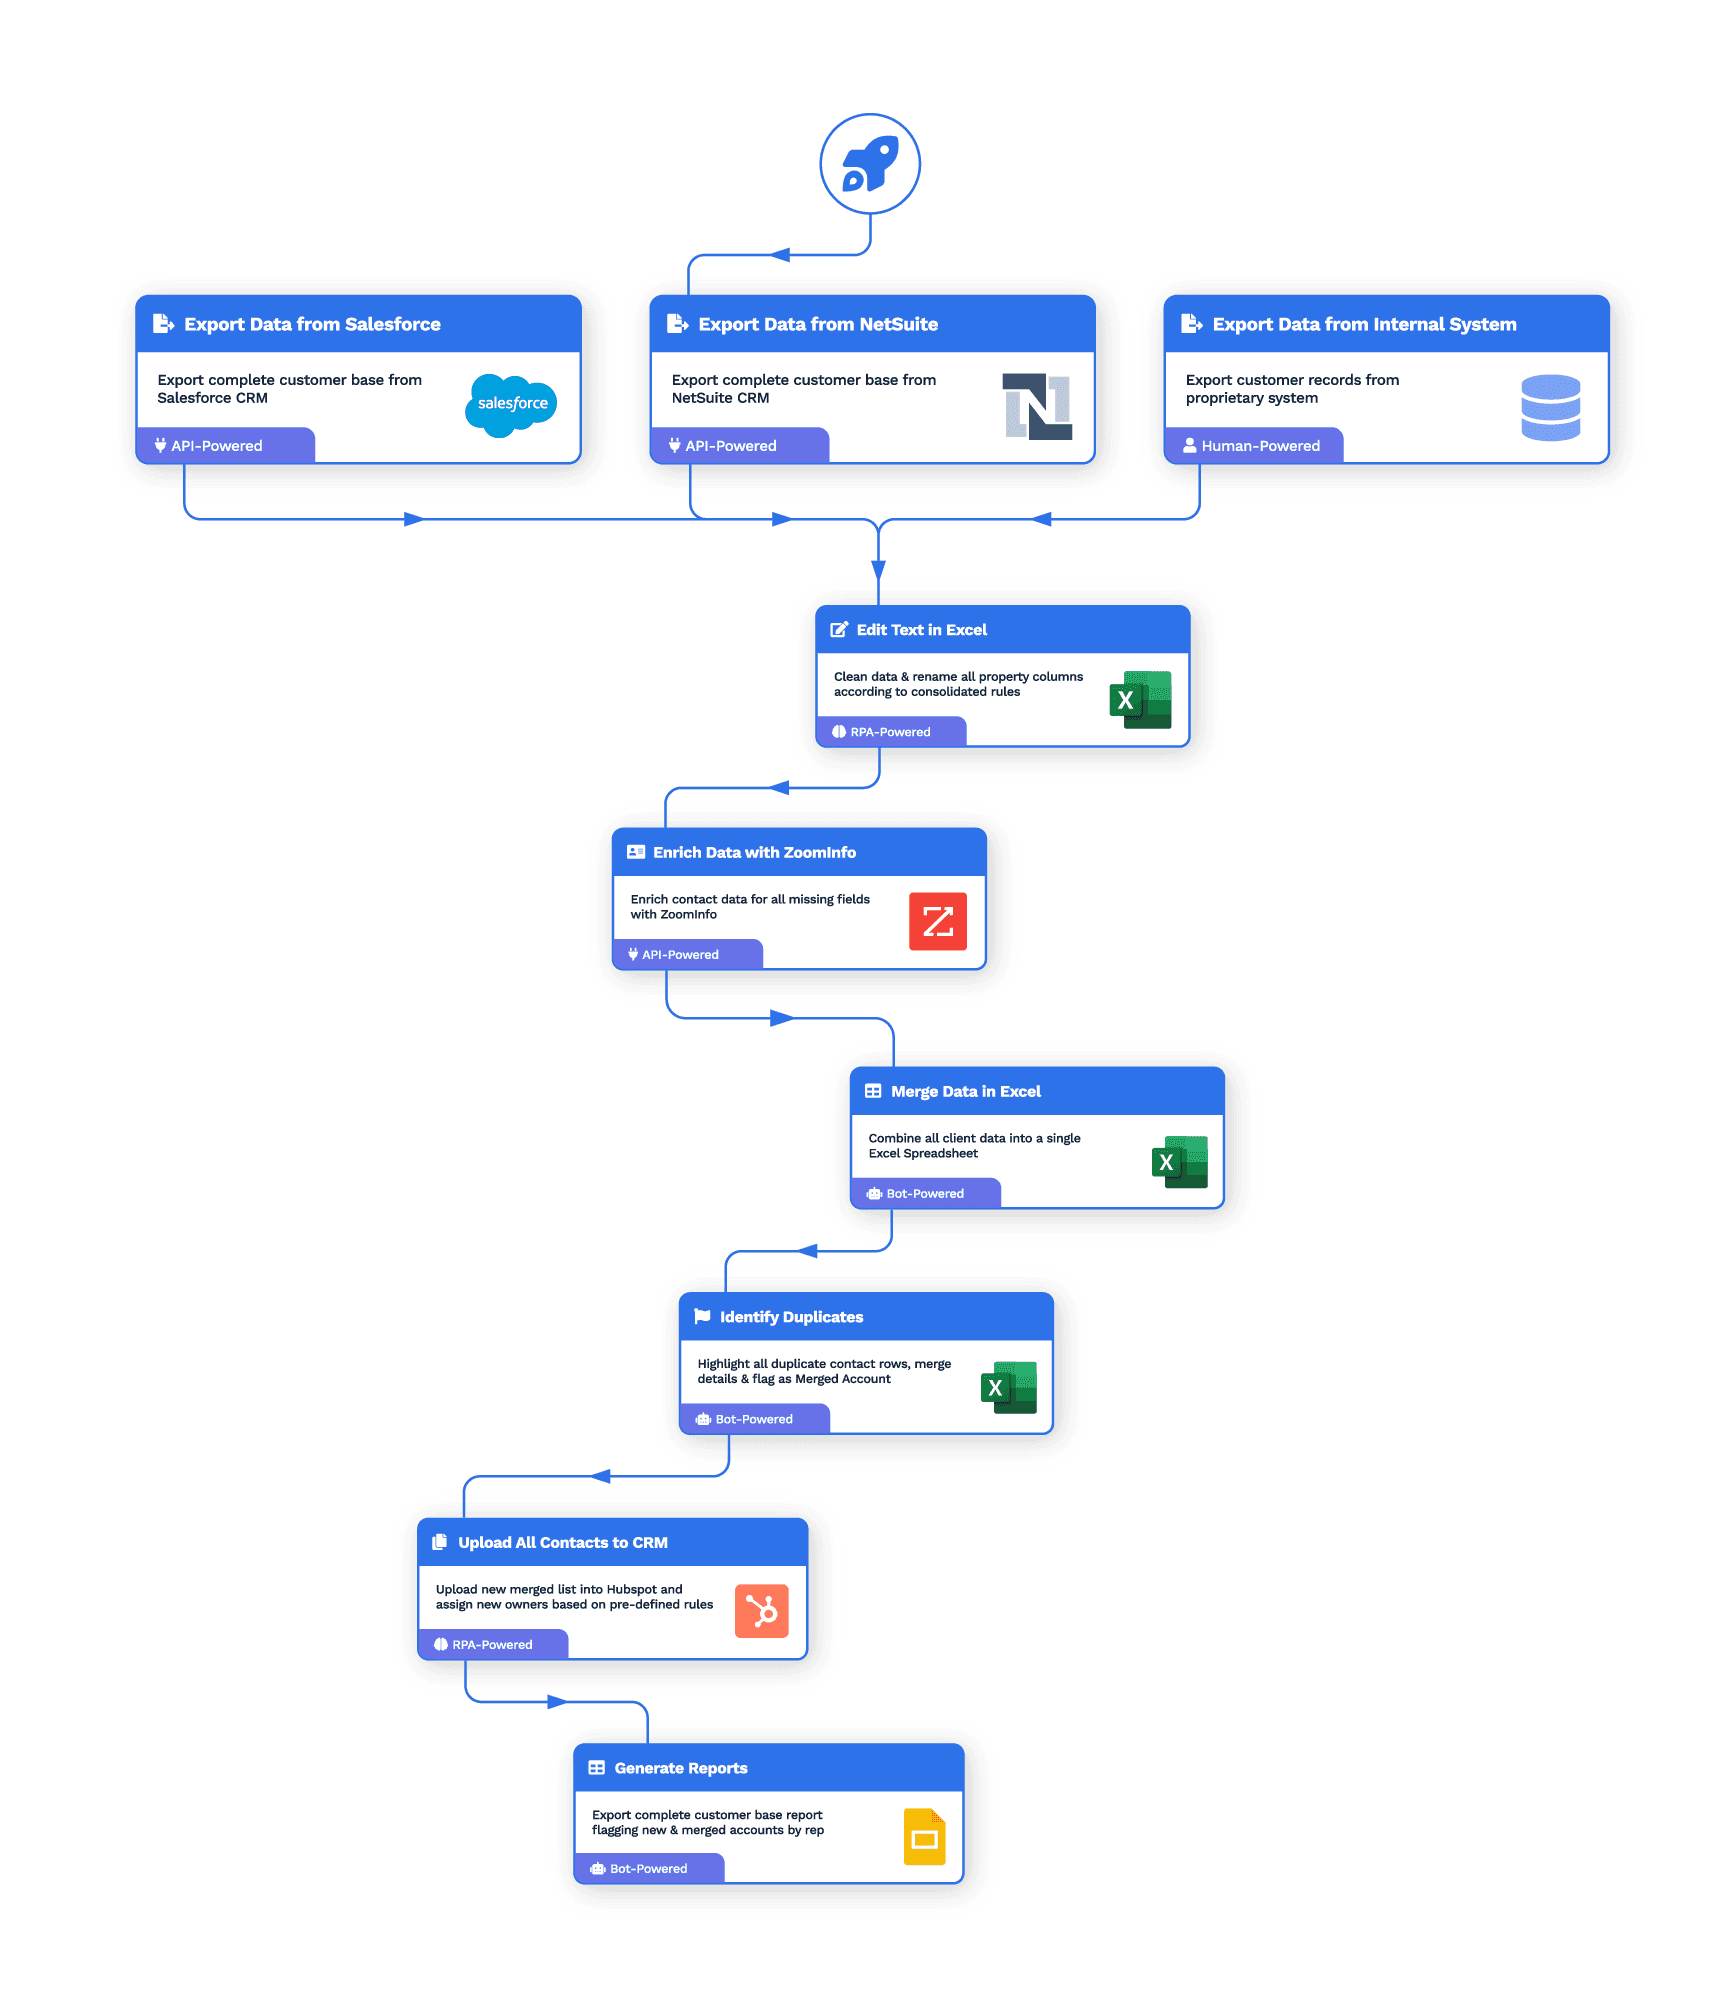
Could only be done ad hoc when someone on the team had timeWrk Automation
Web Process Automation
Process begins everytime a new work assignment is received.
Web Process Automation
Filter the company data based on factors like country and remove previously found companies via Robotic Process Automation (RPA)
Zoominfo connector
Find leads based on the company data from the initial data
API Sync
Add or update leads in client’s marketing tool via API
Impact
Efficiency gain
Time saved from marketing so they can spend more time on more specialized tasks
Effortless scale
Leads delivered daily at scale
Use Case
Automated Invoice Matching for Seamless Reconciliation
Reconcile drop-shipped invoices to the invoices of a distributor
HOW WE SOLVED IT FOR THIS CLIENT
Accurate and efficient
invoice reconciliationChallenges
Time consuming
Our client required reconciling invoices they send to clients with the distributor’s invoices for 100’s of invoices a monthInefficiency
A lot of time was spent comparing and collating the information
Scalability Issues
Could only be done ad hoc when someone on the team had timeWrk Automation
Email triggered
Process begins everytime a new email is received.
Optical Character Recognition
Information from every invoice is extracted using OCR
Google Sheets & QuickBooks Online
Invoice data is written into Sheets and matched together with custom formulas, and then sent to QuickBooks Online
Impact
Efficiency gain
Time saved from reading and comparing invoices manually
Effortless scale
Data delivered at scale whenever a new invoice comes in
Use Case
Effortless Document Data Extraction Directly to Spreadsheet
Instantly extract key details from documents and transfer them into structured data
HOW WE SOLVED IT FOR THIS CLIENT
Accurate and efficient
data extractionChallenges
Time consuming
Having to extract all the details manually would have taken too much timeInefficiency
PDFs aren't designed for seamless data access
Scalability Issues
Our client required a more holistic view of details about their work from PDF documentsWrk Automation
Email triggered
Process begins everytime a new email is received.
Optical Character Recognition
Information from every document is extracted using OCR
Google Sheets
Data is written in a structured datasheet that allows more analysis to be done
Impact
Efficiency gain
Time saved from having to manually extract details from the documents
Effortless scale
Data delivered at scale whenever a new document comes in
Strategically organized
Data in a structured spreadsheet is easier to manipulate and analyze
Use Case
Streamlined Work Order Responses for Property Management
Enhance your property management efficiency with automated responses to new work orders
HOW WE SOLVED IT FOR THIS CLIENT
Improved efficiency and consistency
Challenges
Time consuming
Manually responding to each work order can be incredibly time-intensive, especially as the volume increases.Human error
Miscommunications, forgotten responses, or missed details can lead to frustrated tenants
Scalability Issues
As work orders pile up, managing everything manually becomes overwhelmingWrk Automation
Email triggered
Process begins everytime a new work order email is received.
Generative AI
Troubleshooting tips are generated based on the work order details
Web Process Automation
A message is sent to the client by automating the work order management website using Robotic Process Automation (RPA)
Impact
Efficiency gain
Fast response times, ensuring work orders are acknowledged and processed quickly without manual intervention
Effortless scale
Data delivered at scale whenever a new work order comes in
Improved Consistency
Automated responses ensure uniformity in communication
Use Case
Auto-Assign Work Orders for Effortless Property Management
Effortlessly delegate tasks with automated work order assignment
HOW WE SOLVED IT FOR THIS CLIENT
Improved efficiency and consistency
Challenges
Time consuming
Manually assigning each work order can be incredibly time-intensive, especially as the volume increases.Inconsistent Data
Information about preferred vendors is different from the work order management software’s information
Scalability Issues
As work orders pile up, managing everything manually becomes overwhelmingWrk Automation
Email triggered
Process begins everytime a new work order email is received.
Generative AI
Does a “fuzzy match” on the name of the vendor on file vs what is found in the property management software
Web Process Automation
The matching name is assigned in the property management software using Robotic Process Automation (RPA)
Impact
Efficiency gain
Fast response times, ensuring work orders are assigned quickly without manual intervention
Effortless scale
Assignment at scale whenever a new work order comes in
Improved Consistency
Work orders are assigned without having to compare names with 100’s of vendors
Use Case
Seamless Payments, Simplified: Automated Reconciliation
Extract transaction data and reconcile against CRM records
HOW WE SOLVED IT FOR THIS CLIENT
Accurate and efficient
payment reconciliationChallenges
Manual Data Entry
Time-consuming and prone to errorsDelayed Processing
Delays in reconciling payments can impact cash flow
Inaccurate Designations
Mismatched payment and program information can lead to errorsReport Generation Difficulties
Manual reporting is time-consuming and prone to inaccuraciesWrk Automation
Data sources API
Pulls all transaction and donor data from payment portal
CRM API
Logs all missing gifts via API
Web Process Automation
Updates any gift with an incorrect fund designation via Robotic Process Automation (RPA)
Impact
Efficiency gain
Reduced manual workload, improved processing times
Accuracy
Increased data accuracy and consistency, reduced errors
Insights
Enhanced reporting capabilities for data-driven decision making
Transparency
Improved visibility into donation management processes
Use Case
Synchronized Success: Real-Time Data Synchronization
Synchronize data in real-time between two or more separate systems
HOW WE SOLVED IT FOR THIS CLIENT
Real-time
data synchronization
across multiple systemsChallenges
Manual Data Synchronization
Time-consuming and error-proneDelayed Processing
Mismatched data across systems can lead to inaccuracies
Error Risk
Increased risk of data errors and omissions due to manual processes.Inefficient Resource Allocation
Significant time and effort spent on data managementWrk Automation
Webhooks
Webhook calls are received whenever a change is made to an opportunity
API Connectors
Locate the equivalent record in the other system, and add/update the record via API
Impact
Efficiency
Reduced manual workload, improved productivity
Accuracy
Enhanced data consistency and accuracy, reduced errors
Security
Improved security by reducing the need for multiple teams to access systems.
Operational Efficiency
Streamlined workflows and improved decision-making
Use Case
Streamlined Admissions: Automated Data Verification
Extract data from documents, verify against applicant information, and update records
HOW WE SOLVED IT FOR THIS CLIENT
Accurate and complete applicant data, streamlined admissions process
Challenges
Manual Data Entry
Time-consuming and prone to errorsInefficient Document Verification
Slow and error-prone manual processes
Low-Quality Images
Poor image quality can hinder data extractionData Inconsistency
Mismatched data across systems can lead to inaccuraciesWrk Automation
Webhooks
Webhook calls are received whenever a student application is received
Optical Character Recognition
Verifies document image quality and extracts information from submitted documents using OCRAPI Connectors
Compare existing record data and update any discrepancies via API
Impact
Efficiency
Reduced manual workload, improved processing times
Accuracy
Enhanced data accuracy and consistency, reduced errors
Quality
Improved document quality and legibility
Applicant Experience
Faster processing times and improved satisfaction
Use Case
Dynamic Reports, Delivered: Automated PDF Generation
Generate custom PDF reports based on dynamic templates and data
HOW WE SOLVED IT FOR THIS CLIENT
Personalized and professional reports at scale, delivered automatically
Challenges
Manual Report Recreation
Time-consuming and error-proneData Gathering
Difficulty collecting and compiling accurate data
Inconsistent Layout
Maintaining consistent report layout and content can be challengingScalability Issues
Difficulty scaling reporting as the donor base growsWrk Automation
Human in the loop
Humans retrieve images for the reports based on strict criteria
API Connectors
Extract report data from source platform via API, and dynamically customize each report’s content and layout
Impact
Efficiency
Reduced manual workload, improved processing times
Accuracy
Enhanced data accuracy and consistency, reduced errors
Scalability
Increased efficiency and scalability of reporting processes
Timeliness
Ability to provide donors with timely updates on the impact of their donations
Use Case
Receipting Made Easy: Automated, Accurate, Efficient
Verify addresses and issue official donation receipts automatically
HOW WE SOLVED IT FOR THIS CLIENT
20,000+ receipts
automatically deliveredChallenges
Manual Address Verification
Time-consuming and error-proneInefficient Receipt Issuance
Slow and manual processes
Inaccurate Addresses
Incorrect addresses can lead to undelivered receiptsScalability Issues
Difficulty handling large volumes of receipts.Wrk Automation
API Connectors
Extract all donor in CRM database via API, verify each donor’s address, and dynamically generates each individual receipt
Gmail API
Sends each individual donor’s receipt via API
Impact
Efficiency
Reduced manual workload, improved processing times
Accuracy
Enhanced address accuracy, reduced errors
Scalability
Increased efficiency and scalability for handling large volumes of receipts
Timeliness
Timely receipt issuance, improved donor satisfaction
Use Case
Skin Analysis Simplified: Personalized Treatment Recommendations
Analyze skin images, provide treatment recommendations, and send notifications
HOW WE SOLVED IT FOR THIS CLIENT
Instant and accurate analysis and treatment recommendations
Challenges
Manual Analysis
Time-consuming and subjectivenaccurate Assessments
Manual assessments can be prone to errors
Limited Personalization
Difficulty providing personalized treatment recommendationsInefficient Communication
Inefficient Communication: Delayed or inconsistent communication with patientsWrk Automation
Webhooks
Webhook calls are received whenever a patient submits an image of themselves
AI bots
Perform multiple different analyses of the imageAPI Connectors
Generate and send results to patient in an email, SMS message, and voicemail
Impact
Efficiency
Reduced manual workload, improved processing times
Accuracy
Improved accuracy of skin analysis and recommendations
Personalization
Tailored treatment recommendations for individual patients
Communication
Improved patient communication and engagement
Use Case
Turn Conversations into Tickets: Automated Ticket Creation
Convert Slack messages into tickets and assign to appropriate teams
HOW WE SOLVED IT FOR THIS CLIENT
Efficient ticket management, improved response times, enhanced customer satisfaction
Challenges
Manual Ticket Creation
Time-consuming and error-proneDelayed Responses
Delayed response times to customer inquiries
Inconsistent Tracking
Difficulty tracking and managing customer requestsInefficient Communication
Inefficient communication channels can lead to customer dissatisfactionWrk Automation
Webhooks
Webhook calls are received whenever a customer messages a Slack channel
API Connectors
Extract the Slack user’s details and the request details
API Connectors
Create, via API, the request in the ticketing system, and the original Slack message is reacted to to acknowledge the reception of the request
Impact
Efficiency
Reduced manual workload, improved response times
Organization
Streamlined ticket management, improved tracking
Communication
Improved communication and collaboration between teams
Customer Satisfaction
Enhanced customer satisfaction through timely responses
Use Case
Fuel Your AI: Automated Data Extraction and Preparation
Extract data, prepare for AI training, and deliver to model
HOW WE SOLVED IT FOR THIS CLIENT
Clean, structured data for AI model training, accelerated insights
Challenges
Manual Data Extraction
Time-consuming and error-proneInconsistent Data
Data from SEC filings is inconsistently formatted and difficult to processData Preparation
Preparing data for AI training can be complex and time-consumingScalability Issues
Difficulty handling large volumes of dataWrk Automation
Web Process Automation
Pulls a list of the current S&P 500 companies via Robotic Process AutomationSEC EDGAR Filings API
Retrieves each company’s latest 10-K documentHuman in the loop
Humans meticulously extracts each individual risk factor found in each 10-K document
API Sync
Summarize each individual risk factor section and convert to JSON
Gmail API
Delivers the outputted JSON file to the client for upload into AI model
Impact
Efficiency
Reduced manual workload, improved processing times
Accuracy
mproved data accuracy and consistency
Scalability
Increased efficiency and scalability for handling large datasets
AI Model Performance
High-quality data can improve AI model performance
Use Case
Effortless Intent Based Lead Generation at Scale
Consume intent data on a daily basis and
extract leadsHOW WE SOLVED IT FOR THIS CLIENT
100s of fresh leads
every dayChallenges
Time consuming
Our client’s marketing team manually getting leads from their G2 dataInefficiency
A lot of time was spent filtering and searching for relevant leads from the data
Scalability Issues
Could only be done ad hoc when someone on the team had timeImpact
Efficiency gain
Time saved from marketing so they can spend more time on more specialized tasks
Effortless scale
Leads delivered daily at scale
Wrk Automation
Web Process Automation
Process begins everytime a new work assignment is received.
Web Process Automation
Filter the company data based on factors like country and remove previously found companies
Zoominfo Wrk Action
Find leads based on the company data from the initial data
API Sync
add or update leads in client’s marketing tool
Use Case
Automated Invoice Matching
for Seamless ReconciliationReconcile drop-shipped invoices to the invoices of a distributor
HOW WE SOLVED IT FOR THIS CLIENT
Accurate and efficient
invoice reconciliation
Challenges
Time consuming
Our client required reconciling invoices they send to clients with the distributor’s invoices for 100’s of invoices a monthInefficiency
A lot of time was spent comparing and collating the information
Scalability Issues
Could only be done ad hoc when someone on the team had timeImpact
Efficiency gain
Time saved from reading and comparing invoices manually
Effortless scale
Data delivered at scale whenever a new invoice comes in
Wrk Automation
Email triggered
Process begins everytime a new email is received.
Optical Character Recognition
Information from every invoice is extracted using OCR
Google Sheets
Invoice data is written into Sheets and matched together with custom formulas
Use Case
Effortless Intent Based Lead Generation at Scale
Consume intent data on a daily basis and
extract leadsHOW WE SOLVED IT FOR THIS CLIENT
Accurate and efficient
data extractionChallenges
Time consuming
Having to extract all the details manually would have taken too much timeInefficiency
PDFs aren't designed for seamless data access
Scalability Issues
Our client required a more holistic view of details about their work from PDF documentsImpact
Efficiency gain
Time saved from having to manually extract details from the documents
Effortless scale
Data delivered at scale whenever a new document comes in
Strategically organized
Data in a structured spreadsheet is easier to manipulate and analyze
Wrk Automation
Email triggered
Process begins everytime a new email is received.
Optical Character Recognition
Information from every document is extracted using OCR
Google Sheets
Data is written in a structured datasheet that allows more analysis to be done
Use Case
Streamlined Work Order Responses for Property Management
Enhance your property management efficiency with automated responses to new work orders
HOW WE SOLVED IT FOR THIS CLIENT
Improved efficiency and consistency
Challenges
Time consuming
Manually responding to each work order can be incredibly time-intensive, especially as the volume increases.Human Error
Miscommunications, forgotten responses, or missed details can lead to frustrated tenant
Scalability Issues
As work orders pile up, managing everything manually becomes overwhelmingImpact
Efficiency gain
Fast response times, ensuring work orders are acknowledged and processed quickly without manual intervention
Effortless scale
Data delivered at scale whenever a new work order comes in
Strategically organized
Data in a structured spreadsheet is easier to manipulate and analyze
Wrk Automation
Email triggered
Process begins everytime a new work order email is received.
Generative AI
Troubleshooting tips are generated based on the work order details
Web Process Automation
A message is sent to the client by automating the work order management website
Use Case
Auto-Assign Work Orders for Effortless Property Management
Effortlessly delegate tasks with automated work
order assignmentHOW WE SOLVED IT FOR THIS CLIENT
Improved efficiency and consistency
Challenges
Time consuming
Manually assigning each work order can be incredibly time-intensive, especially as the volume increases.Inconsistent Data
Information about preferred vendors is different from the work order management software’s information
Scalability Issues
As work orders pile up, managing everything manually becomes overwhelmingImpact
Efficiency gain
Fast response times, ensuring work orders are assigned quickly without manual intervention
Effortless scale
Assignment at scale whenever a new work order comes in
Improved Consistency
Work orders are assigned without having to compare names with 100’s of vendorsWrk Automation
Email triggered
Process begins everytime a new work order email is received.
Generative AI
Does a “fuzzy match” on the name of the vendor on file vs what is found in the property management softwareWeb Process Automation
The matching name is assigned in the property management softwareUse Case
Seamless Payments, Simplified: Automated Reconciliation
Extract transaction data and reconcile against CRM records
HOW WE SOLVED IT FOR THIS CLIENT
Accurate and efficient
payment reconciliationChallenges
Manual Data Entry
Time-consuming and prone to errorsDelayed Processing
Delays in reconciling payments can impact cash flow
Inaccurate Designations
Mismatched payment and program information can lead to errorsReport Generation Difficulties
Manual reporting is time-consuming and prone to inaccuraciesImpact
Efficiency
Reduced manual workload, improved processing times
Accuracy
Increased data accuracy and consistency, reduced errors
Insights
Enhanced reporting capabilities for data-driven decision makingTransparency
Improved visibility into donation management processes
Wrk Automation
Data sources API
Pulls all transaction and donor data from payment portal
CRM API
Logs all missing giftsWeb Process Automation
updates any gift with an incorrect fund designationUse Case
Synchronized Success: Real-Time Data Synchronization
Synchronize data in real-time between two or more separate systems
HOW WE SOLVED IT FOR THIS CLIENT
Real-time data
synchronization
across multiple systemsChallenges
Manual Data Synchronization
Time-consuming and prone to errorsData Inconsistency
Mismatched data across systems can lead to inaccuraciesError Risk
Increased risk of data errors and omissions due to manual processes.Inefficient Resource Allocation
Significant time and effort spent on data managementImpact
Efficiency
Reduced manual workload, improved productivity
Accuracy
Enhanced data consistency and accuracy, reduced errors
Security
Improved security by reducing the need for multiple teams to access systems.Operational Efficiency
Streamlined workflows and improved decision-making
Wrk Automation
Webhooks
are received whenever a change is made to an opportunity
API Connectors
Locate the equivalent record in the other system, and add/update the recordUse Case
Streamlined Admissions: Automated Data Verification
Extract data from documents, verify against applicant information, and update records
HOW WE SOLVED IT FOR THIS CLIENT
Accurate and complete applicant data, streamlined admissions process
Challenges
Manual Data Entry
Time-consuming and prone to errorsInefficient Document Verification
Slow and error-prone manual processesLow-Quality Images
Poor image quality can hinder data extractionData Inconsistency
Mismatched data across systems can lead to inaccuraciesImpact
Efficiency
Reduced manual workload, improved processing times
Accuracy
Enhanced data accuracy and consistency, reduced errors
Quality
Improved document quality and legibilityApplicant Experience
Faster processing times and improved satisfaction
Wrk Automation
Webhooks
are received whenever a student application is received
Optical Character Recognition
verifies document image quality and extracts information from submitted documentsAPI Connectors
compare existing record data and update any discrepanciesUse Case
Dynamic Reports, Delivered: Automated PDF Generation
Generate custom PDF reports based on dynamic templates and data
HOW WE SOLVED IT FOR THIS CLIENT
Personalized and professional reports at scale, delivered automatically
Challenges
Manual Report Creation
Time-consuming and error-proneData Gathering
Difficulty collecting and compiling accurate dataInconsistent Layout
Maintaining consistent report layout and content can be challengingScalability Issues
Difficulty scaling reporting as the donor base growsImpact
Efficiency
Reduced manual workload, improved processing timesAccuracy
Enhanced data accuracy and consistency, reduced errorsScalability
Increased efficiency and scalability of reporting processesTimeliness
Ability to provide donors with timely updates on the impact of their donationsWrk Automation
Human in the loop
retrieves images for the reports based on strict criteriaAPI Connectors
extract report data from source platform, and dynamically customize each report’s content and layoutUse Case
Receipting Made Easy: Automated, Accurate, Efficient
Verify addresses and issue official donation receipts automatically
HOW WE SOLVED IT FOR THIS CLIENT
20,000+ receipts
automatically deliveredChallenges
Manual Address Verification
Time-consuming and error-proneInefficient Receipt Issuance
Slow and manual processesInaccurate Addresses
Incorrect addresses can lead to undelivered receiptsScalability Issues
Difficulty handling large volumes of receipts.Impact
Efficiency
Reduced manual workload, improved processing timesAccuracy
Enhanced data accuracy, reduced errorsScalability
Increased efficiency and scalability for handling large volumes of receiptsTimeliness
Aimely receipt issuance, improved donor satisfactionWrk Automation
API Connectors
extract all donor in CRM database, verify each donor’s address, and dynamically generates each individual receiptGmail API
sends each individual donor’s receiptUse Case
Skin Analysis Simplified: Personalized Treatment Recommendations
Analyze skin images, provide treatment recommendations, and send notifications
HOW WE SOLVED IT FOR THIS CLIENT
Instant and accurate analysis and treatment recommendations
Challenges
Manual Analysis
Time-consuming and subjectiveInaccurate Assessments
Manual assessments can be prone to errorsLimited Personalization
Difficulty providing personalized treatment recommendationsInefficient Communication
Inefficient Communication: Delayed or inconsistent communication with patientsImpact
Efficiency
Reduced manual workload, improved processing timesAccuracy
Improved accuracy of skin analysis and recommendationsPersonalization
Tailored treatment recommendations for individual patientsCommunication
Improved patient communication and engagementWrk Automation
Webhooks
are received whenever a patient submits an image of themselvesAI bots
perform multiple different analyses of the imageAPI Connectors
generate and send results to patient in an email, SMS message, and voicemailUse Case
Turn Conversations into Tickets: Automated Ticket Creation
Convert Slack messages into tickets and assign to appropriate teams
HOW WE SOLVED IT FOR THIS CLIENT
Efficient ticket management, improved response times, enhanced customer satisfaction
Challenges
Manual Ticket Creation
Time-consuming and error-proneDelayed Responses
Delayed response times to customer inquiriesInconsistent Tracking
Difficulty tracking and managing customer requestsInefficient Communication
Inefficient communication channels can lead to customer dissatisfactionImpact
Efficiency
Reduced manual workload, improved response timesOrganization
Streamlined ticket management, improved trackingCommunication
Improved communication and collaboration between teamsCustomer Satisfaction
Enhanced customer satisfaction through timely responsesWrk Automation
Webhooks
are received whenever a customer messages a Slack channelAPI Connectors
extract the Slack user’s details and the request detailsAPI Connectors
create the request in the ticketing system, and the original Slack message is reacted to to acknowledge the reception of the requestUse Case
Fuel Your AI: Automated Data Extraction and Preparation
Extract data, prepare for AI training, and deliver
to modelHOW WE SOLVED IT FOR THIS CLIENT
Clean, structured data for AI model training, accelerated insights
Challenges
Manual Data Extraction
Time-consuming and error-proneInconsistent Data
Data from SEC filings is inconsistently formatted and difficult to processData Preparation
Preparing data for AI training can be complex and time-consumingScalability Issues
Difficulty handling large volumes of dataImpact
Efficiency
Reduced manual workload, improved processing timesAccuracy
Improved data accuracy and consistencyScalability
Increased efficiency and scalability for handling large datasetsAI Model Performance
High-quality data can improve AI model performanceWrk Automation
Web Process Automation
pulls a list of the current S&P 500 companiesSEC EDGAR Filings API
retrieves each company’s latest 10-K documentHuman in the loop
meticulously extracts each individual risk factor found in each 10-K documentAI bots
summarize each individual risk factor section and convert to JSONGmail API
delivers the outputted JSON file to the client for upload into AI model
Use Case
Effortless Intent Based Lead Generation at Scale
Consume intent data on a daily basis and
extract leadsHOW WE SOLVED IT FOR THIS CLIENT
100s of fresh leads
every dayChallenges
Time consuming
Our client’s marketing team manually getting leads from their G2 dataInefficiency
A lot of time was spent filtering and searching for relevant leads from the data
Scalability Issues
Could only be done ad hoc when someone on the team had timeImpact
Efficiency gain
Time saved from marketing so they can spend more time on more specialized tasks
Effortless scale
Leads delivered daily at scale
Wrk Automation
Web Process Automation
Process begins everytime a new work assignment is received.
Web Process Automation
Filter the company data based on factors like country and remove previously found companies
Zoominfo Wrk Action
Find leads based on the company data from the initial data
API Sync
add or update leads in client’s marketing tool
Use Case
Automated Invoice Matching
for Seamless ReconciliationReconcile drop-shipped invoices to the invoices of a distributor
HOW WE SOLVED IT FOR THIS CLIENT
Accurate and efficient
invoice reconciliation
Challenges
Time consuming
Our client required reconciling invoices they send to clients with the distributor’s invoices for 100’s of invoices a monthInefficiency
A lot of time was spent comparing and collating the information
Scalability Issues
Could only be done ad hoc when someone on the team had timeImpact
Efficiency gain
Time saved from reading and comparing invoices manually
Effortless scale
Data delivered at scale whenever a new invoice comes in
Wrk Automation
Email triggered
Process begins everytime a new email is received.
Optical Character Recognition
Information from every invoice is extracted using OCR
Google Sheets
Invoice data is written into Sheets and matched together with custom formulas
Use Case
Effortless Intent Based Lead Generation at Scale
Consume intent data on a daily basis and
extract leadsHOW WE SOLVED IT FOR THIS CLIENT
Accurate and efficient
data extractionChallenges
Time consuming
Having to extract all the details manually would have taken too much timeInefficiency
PDFs aren't designed for seamless data access
Scalability Issues
Our client required a more holistic view of details about their work from PDF documentsImpact
Efficiency gain
Time saved from having to manually extract details from the documents
Effortless scale
Data delivered at scale whenever a new document comes in
Strategically organized
Data in a structured spreadsheet is easier to manipulate and analyze
Wrk Automation
Email triggered
Process begins everytime a new email is received.
Optical Character Recognition
Information from every document is extracted using OCR
Google Sheets
Data is written in a structured datasheet that allows more analysis to be done
Use Case
Streamlined Work Order Responses for Property Management
Enhance your property management efficiency with automated responses to new work orders
HOW WE SOLVED IT FOR THIS CLIENT
Improved efficiency and consistency
Challenges
Time consuming
Manually responding to each work order can be incredibly time-intensive, especially as the volume increases.Human Error
Miscommunications, forgotten responses, or missed details can lead to frustrated tenant
Scalability Issues
As work orders pile up, managing everything manually becomes overwhelmingImpact
Efficiency gain
Fast response times, ensuring work orders are acknowledged and processed quickly without manual intervention
Effortless scale
Data delivered at scale whenever a new work order comes in
Strategically organized
Data in a structured spreadsheet is easier to manipulate and analyze
Wrk Automation
Email triggered
Process begins everytime a new work order email is received.
Generative AI
Troubleshooting tips are generated based on the work order details
Web Process Automation
A message is sent to the client by automating the work order management website
Use Case
Auto-Assign Work Orders for Effortless Property Management
Effortlessly delegate tasks with automated work
order assignmentHOW WE SOLVED IT FOR THIS CLIENT
Improved efficiency and consistency
Challenges
Time consuming
Manually assigning each work order can be incredibly time-intensive, especially as the volume increases.Inconsistent Data
Information about preferred vendors is different from the work order management software’s information
Scalability Issues
As work orders pile up, managing everything manually becomes overwhelmingImpact
Efficiency gain
Fast response times, ensuring work orders are assigned quickly without manual intervention
Effortless scale
Assignment at scale whenever a new work order comes in
Improved Consistency
Work orders are assigned without having to compare names with 100’s of vendorsWrk Automation
Email triggered
Process begins everytime a new work order email is received.
Generative AI
Does a “fuzzy match” on the name of the vendor on file vs what is found in the property management softwareWeb Process Automation
The matching name is assigned in the property management softwareUse Case
Seamless Payments, Simplified: Automated Reconciliation
Extract transaction data and reconcile against CRM records
HOW WE SOLVED IT FOR THIS CLIENT
Accurate and efficient
payment reconciliationChallenges
Manual Data Entry
Time-consuming and prone to errorsDelayed Processing
Delays in reconciling payments can impact cash flow
Inaccurate Designations
Mismatched payment and program information can lead to errorsReport Generation Difficulties
Manual reporting is time-consuming and prone to inaccuraciesImpact
Efficiency
Reduced manual workload, improved processing times
Accuracy
Increased data accuracy and consistency, reduced errors
Insights
Enhanced reporting capabilities for data-driven decision makingTransparency
Improved visibility into donation management processes
Wrk Automation
Data sources API
Pulls all transaction and donor data from payment portal
CRM API
Logs all missing giftsWeb Process Automation
updates any gift with an incorrect fund designationUse Case
Synchronized Success: Real-Time Data Synchronization
Synchronize data in real-time between two or more separate systems
HOW WE SOLVED IT FOR THIS CLIENT
Real-time data
synchronization
across multiple systemsChallenges
Manual Data Synchronization
Time-consuming and prone to errorsData Inconsistency
Mismatched data across systems can lead to inaccuraciesError Risk
Increased risk of data errors and omissions due to manual processes.Inefficient Resource Allocation
Significant time and effort spent on data managementImpact
Efficiency
Reduced manual workload, improved productivity
Accuracy
Enhanced data consistency and accuracy, reduced errors
Security
Improved security by reducing the need for multiple teams to access systems.Operational Efficiency
Streamlined workflows and improved decision-making
Wrk Automation
Webhooks
are received whenever a change is made to an opportunity
API Connectors
Locate the equivalent record in the other system, and add/update the recordUse Case
Streamlined Admissions: Automated Data Verification
Extract data from documents, verify against applicant information, and update records
HOW WE SOLVED IT FOR THIS CLIENT
Accurate and complete applicant data, streamlined admissions process
Challenges
Manual Data Entry
Time-consuming and prone to errorsInefficient Document Verification
Slow and error-prone manual processesLow-Quality Images
Poor image quality can hinder data extractionData Inconsistency
Mismatched data across systems can lead to inaccuraciesImpact
Efficiency
Reduced manual workload, improved processing times
Accuracy
Enhanced data accuracy and consistency, reduced errors
Quality
Improved document quality and legibilityApplicant Experience
Faster processing times and improved satisfaction
Wrk Automation
Webhooks
are received whenever a student application is received
Optical Character Recognition
verifies document image quality and extracts information from submitted documentsAPI Connectors
compare existing record data and update any discrepanciesUse Case
Dynamic Reports, Delivered: Automated PDF Generation
Generate custom PDF reports based on dynamic templates and data
HOW WE SOLVED IT FOR THIS CLIENT
Personalized and professional reports at scale, delivered automatically
Challenges
Manual Report Creation
Time-consuming and error-proneData Gathering
Difficulty collecting and compiling accurate dataInconsistent Layout
Maintaining consistent report layout and content can be challengingScalability Issues
Difficulty scaling reporting as the donor base growsImpact
Efficiency
Reduced manual workload, improved processing timesAccuracy
Enhanced data accuracy and consistency, reduced errorsScalability
Increased efficiency and scalability of reporting processesTimeliness
Ability to provide donors with timely updates on the impact of their donationsWrk Automation
Human in the loop
retrieves images for the reports based on strict criteriaAPI Connectors
extract report data from source platform, and dynamically customize each report’s content and layoutUse Case
Receipting Made Easy: Automated, Accurate, Efficient
Verify addresses and issue official donation receipts automatically
HOW WE SOLVED IT FOR THIS CLIENT
20,000+ receipts
automatically deliveredChallenges
Manual Address Verification
Time-consuming and error-proneInefficient Receipt Issuance
Slow and manual processesInaccurate Addresses
Incorrect addresses can lead to undelivered receiptsScalability Issues
Difficulty handling large volumes of receipts.Impact
Efficiency
Reduced manual workload, improved processing timesAccuracy
Enhanced data accuracy, reduced errorsScalability
Increased efficiency and scalability for handling large volumes of receiptsTimeliness
Aimely receipt issuance, improved donor satisfactionWrk Automation
API Connectors
extract all donor in CRM database, verify each donor’s address, and dynamically generates each individual receiptGmail API
sends each individual donor’s receiptUse Case
Skin Analysis Simplified: Personalized Treatment Recommendations
Analyze skin images, provide treatment recommendations, and send notifications
HOW WE SOLVED IT FOR THIS CLIENT
Instant and accurate analysis and treatment recommendations
Challenges
Manual Analysis
Time-consuming and subjectiveInaccurate Assessments
Manual assessments can be prone to errorsLimited Personalization
Difficulty providing personalized treatment recommendationsInefficient Communication
Inefficient Communication: Delayed or inconsistent communication with patientsImpact
Efficiency
Reduced manual workload, improved processing timesAccuracy
Improved accuracy of skin analysis and recommendationsPersonalization
Tailored treatment recommendations for individual patientsCommunication
Improved patient communication and engagementWrk Automation
Webhooks
are received whenever a patient submits an image of themselvesAI bots
perform multiple different analyses of the imageAPI Connectors
generate and send results to patient in an email, SMS message, and voicemailUse Case
Turn Conversations into Tickets: Automated Ticket Creation
Convert Slack messages into tickets and assign to appropriate teams
HOW WE SOLVED IT FOR THIS CLIENT
Efficient ticket management, improved response times, enhanced customer satisfaction
Challenges
Manual Ticket Creation
Time-consuming and error-proneDelayed Responses
Delayed response times to customer inquiriesInconsistent Tracking
Difficulty tracking and managing customer requestsInefficient Communication
Inefficient communication channels can lead to customer dissatisfactionImpact
Efficiency
Reduced manual workload, improved response timesOrganization
Streamlined ticket management, improved trackingCommunication
Improved communication and collaboration between teamsCustomer Satisfaction
Enhanced customer satisfaction through timely responsesWrk Automation
Webhooks
are received whenever a customer messages a Slack channelAPI Connectors
extract the Slack user’s details and the request detailsAPI Connectors
create the request in the ticketing system, and the original Slack message is reacted to to acknowledge the reception of the requestUse Case
Fuel Your AI: Automated Data Extraction and Preparation
Extract data, prepare for AI training, and deliver
to modelHOW WE SOLVED IT FOR THIS CLIENT
Clean, structured data for AI model training, accelerated insights
Challenges
Manual Data Extraction
Time-consuming and error-proneInconsistent Data
Data from SEC filings is inconsistently formatted and difficult to processData Preparation
Preparing data for AI training can be complex and time-consumingScalability Issues
Difficulty handling large volumes of dataImpact
Efficiency
Reduced manual workload, improved processing timesAccuracy
Improved data accuracy and consistencyScalability
Increased efficiency and scalability for handling large datasetsAI Model Performance
High-quality data can improve AI model performanceWrk Automation
Web Process Automation
pulls a list of the current S&P 500 companiesSEC EDGAR Filings API
retrieves each company’s latest 10-K documentHuman in the loop
meticulously extracts each individual risk factor found in each 10-K documentAI bots
summarize each individual risk factor section and convert to JSONGmail API
delivers the outputted JSON file to the client for upload into AI model
Use Case
Effortless Intent Based Lead Generation at Scale
Consume intent data on a daily basis and extract leads
HOW WE SOLVED IT FOR THIS CLIENT
100s of fresh leads
every dayChallenges
Time consuming
Our client’s marketing team manually getting leads from their G2 dataInefficiency
A lot of time was spent filtering and searching for relevant leads from the data
Scalability Issues
Could only be done ad hoc when someone on the team had timeImpact
Efficiency gain
Time saved from marketing so they can spend more time on more specialized tasks
Effortless scale
Leads delivered daily at scale
Wrk Automation
Web Process Automation
Process begins everytime a new work assignment is received.
Web Process Automation
Filter the company data based on factors like country and remove previously found companies
Zoominfo Wrk Action
Find leads based on the company data from the initial data
API Sync
add or update leads in client’s marketing tool
Use Case
Automated Invoice Matching
for Seamless ReconciliationReconcile drop-shipped invoices to the invoices of a distributor
HOW WE SOLVED IT FOR THIS CLIENT
Accurate and efficient
invoice reconciliation
Challenges
Time consuming
Our client required reconciling invoices they send to clients with the distributor’s invoices for 100’s of invoices a monthInefficiency
A lot of time was spent comparing and collating the information
Scalability Issues
Could only be done ad hoc when someone on the team had timeImpact
Efficiency gain
Time saved from reading and comparing invoices manually
Effortless scale
Data delivered at scale whenever a new invoice comes in
Wrk Automation
Email triggered
Process begins everytime a new email is received.
Optical Character Recognition
Information from every invoice is extracted using OCR
Google Sheets
Invoice data is written into Sheets and matched together with custom formulas
Use Case
Effortless Intent Based Lead Generation at Scale
Consume intent data on a daily basis and
extract leadsHOW WE SOLVED IT FOR THIS CLIENT
Accurate and efficient
data extractionChallenges
Time consuming
Having to extract all the details manually would have taken too much timeInefficiency
PDFs aren't designed for seamless data access
Scalability Issues
Our client required a more holistic view of details about their work from PDF documentsImpact
Efficiency gain
Time saved from having to manually extract details from the documents
Effortless scale
Data delivered at scale whenever a new document comes in
Strategically organized
Data in a structured spreadsheet is easier to manipulate and analyze
Wrk Automation
Email triggered
Process begins everytime a new email is received.
Optical Character Recognition
Information from every document is extracted using OCR
Google Sheets
Data is written in a structured datasheet that allows more analysis to be done
Use Case
Streamlined Work Order Responses for Property Management
Enhance your property management efficiency with automated responses to new work orders
HOW WE SOLVED IT FOR THIS CLIENT
Improved efficiency and consistency
Challenges
Time consuming
Manually responding to each work order can be incredibly time-intensive, especially as the volume increases.Human Error
Miscommunications, forgotten responses, or missed details can lead to frustrated tenant
Scalability Issues
As work orders pile up, managing everything manually becomes overwhelmingImpact
Efficiency gain
Fast response times, ensuring work orders are acknowledged and processed quickly without manual intervention
Effortless scale
Data delivered at scale whenever a new work order comes in
Strategically organized
Data in a structured spreadsheet is easier to manipulate and analyze
Wrk Automation
Email triggered
Process begins everytime a new work order email is received.
Generative AI
Troubleshooting tips are generated based on the work order details
Web Process Automation
A message is sent to the client by automating the work order management website
Use Case
Auto-Assign Work Orders for Effortless Property Management
Effortlessly delegate tasks with automated work
order assignmentHOW WE SOLVED IT FOR THIS CLIENT
Improved efficiency and consistency
Challenges
Time consuming
Manually assigning each work order can be incredibly time-intensive, especially as the volume increases.Inconsistent Data
Information about preferred vendors is different from the work order management software’s information
Scalability Issues
As work orders pile up, managing everything manually becomes overwhelmingImpact
Efficiency gain
Fast response times, ensuring work orders are assigned quickly without manual intervention
Effortless scale
Assignment at scale whenever a new work order comes in
Improved Consistency
Work orders are assigned without having to compare names with 100’s of vendorsWrk Automation
Email triggered
Process begins everytime a new work order email is received.
Generative AI
Does a “fuzzy match” on the name of the vendor on file vs what is found in the property management softwareWeb Process Automation
The matching name is assigned in the property management softwareUse Case
Seamless Payments, Simplified: Automated Reconciliation
Extract transaction data and reconcile against CRM records
HOW WE SOLVED IT FOR THIS CLIENT
Accurate and efficient
payment reconciliationChallenges
Manual Data Entry
Time-consuming and prone to errorsDelayed Processing
Delays in reconciling payments can impact cash flow
Inaccurate Designations
Mismatched payment and program information can lead to errorsReport Generation Difficulties
Manual reporting is time-consuming and prone to inaccuraciesImpact
Efficiency
Reduced manual workload, improved processing times
Accuracy
Increased data accuracy and consistency, reduced errors
Insights
Enhanced reporting capabilities for data-driven decision makingTransparency
Improved visibility into donation management processes
Wrk Automation
Data sources API
Pulls all transaction and donor data from payment portal
CRM API
Logs all missing giftsWeb Process Automation
updates any gift with an incorrect fund designationUse Case
Synchronized Success: Real-Time Data Synchronization
Synchronize data in real-time between two or more separate systems
HOW WE SOLVED IT FOR THIS CLIENT
Real-time data
synchronization
across multiple systemsChallenges
Manual Data Synchronization
Time-consuming and prone to errorsData Inconsistency
Mismatched data across systems can lead to inaccuraciesError Risk
Increased risk of data errors and omissions due to manual processes.Inefficient Resource Allocation
Significant time and effort spent on data managementImpact
Efficiency
Reduced manual workload, improved productivity
Accuracy
Enhanced data consistency and accuracy, reduced errors
Security
Improved security by reducing the need for multiple teams to access systems.Operational Efficiency
Streamlined workflows and improved decision-making
Wrk Automation
Webhooks
are received whenever a change is made to an opportunity
API Connectors
Locate the equivalent record in the other system, and add/update the recordUse Case
Streamlined Admissions: Automated Data Verification
Extract data from documents, verify against applicant information, and update records
HOW WE SOLVED IT FOR THIS CLIENT
Accurate and complete applicant data, streamlined admissions process
Challenges
Manual Data Entry
Time-consuming and prone to errorsInefficient Document Verification
Slow and error-prone manual processesLow-Quality Images
Poor image quality can hinder data extractionData Inconsistency
Mismatched data across systems can lead to inaccuraciesImpact
Efficiency
Reduced manual workload, improved processing times
Accuracy
Enhanced data accuracy and consistency, reduced errors
Quality
Improved document quality and legibilityApplicant Experience
Faster processing times and improved satisfaction
Wrk Automation
Webhooks
are received whenever a student application is received
Optical Character Recognition
verifies document image quality and extracts information from submitted documentsAPI Connectors
compare existing record data and update any discrepanciesUse Case
Dynamic Reports, Delivered: Automated PDF Generation
Generate custom PDF reports based on dynamic templates and data
HOW WE SOLVED IT FOR THIS CLIENT
Personalized and
professional reports
at scale, delivered
automaticallyChallenges
Manual Report Creation
Time-consuming and error-proneData Gathering
Difficulty collecting and compiling accurate dataInconsistent Layout
Maintaining consistent report layout and content can be challengingScalability Issues
Difficulty scaling reporting as the donor base growsImpact
Efficiency
Reduced manual workload, improved processing timesAccuracy
Enhanced data accuracy and consistency, reduced errorsScalability
Increased efficiency and scalability of reporting processesTimeliness
Ability to provide donors with timely updates on the impact of their donationsWrk Automation
Human in the loop
retrieves images for the reports based on strict criteriaAPI Connectors
extract report data from source platform, and dynamically customize each report’s content and layoutUse Case
Receipting Made Easy: Automated, Accurate, Efficient
Verify addresses and issue official donation receipts automatically
HOW WE SOLVED IT FOR THIS CLIENT
20,000+ receipts
automatically deliveredChallenges
Manual Address Verification
Time-consuming and error-proneInefficient Receipt Issuance
Slow and manual processesInaccurate Addresses
Incorrect addresses can lead to undelivered receiptsScalability Issues
Difficulty handling large volumes of receipts.Impact
Efficiency
Reduced manual workload, improved processing timesAccuracy
Enhanced data accuracy, reduced errorsScalability
Increased efficiency and scalability for handling large volumes of receiptsTimeliness
Aimely receipt issuance, improved donor satisfactionWrk Automation
API Connectors
extract all donor in CRM database, verify each donor’s address, and dynamically generates each individual receiptGmail API
sends each individual donor’s receiptUse Case
Skin Analysis Simplified: Personalized Treatment Recommendations
Analyze skin images, provide treatment recommendations, and send notifications
HOW WE SOLVED IT FOR THIS CLIENT
Instant and accurate
analysis and treatment recommendationsChallenges
Manual Analysis
Time-consuming and subjectiveInaccurate Assessments
Manual assessments can be prone to errorsLimited Personalization
Difficulty providing personalized treatment recommendationsInefficient Communication
Inefficient Communication: Delayed or inconsistent communication with patientsImpact
Efficiency
Reduced manual workload, improved processing timesAccuracy
Improved accuracy of skin analysis and recommendationsPersonalization
Tailored treatment recommendations for individual patientsCommunication
Improved patient communication and engagementWrk Automation
Webhooks
are received whenever a patient submits an image of themselvesAI bots
perform multiple different analyses of the imageAPI Connectors
generate and send results to patient in an email, SMS message, and voicemailUse Case
Turn Conversations into Tickets: Automated Ticket Creation
Convert Slack messages into tickets and assign to appropriate teams
HOW WE SOLVED IT FOR THIS CLIENT
Efficient ticket management, improved response times, enhanced customer satisfaction
Challenges
Manual Ticket Creation
Time-consuming and error-proneDelayed Responses
Delayed response times to customer inquiriesInconsistent Tracking
Difficulty tracking and managing customer requestsInefficient Communication
Inefficient communication channels can lead to customer dissatisfactionImpact
Efficiency
Reduced manual workload, improved response timesOrganization
Streamlined ticket management, improved trackingCommunication
Improved communication and collaboration between teamsCustomer Satisfaction
Enhanced customer satisfaction through timely responsesWrk Automation
Webhooks
are received whenever a customer messages a Slack channelAPI Connectors
extract the Slack user’s details and the request detailsAPI Connectors
create the request in the ticketing system, and the original Slack message is reacted to to acknowledge the reception of the requestUse Case
Fuel Your AI: Automated Data Extraction and Preparation
Extract data, prepare for AI training, and deliver to model
HOW WE SOLVED IT FOR THIS CLIENT
Clean, structured data for AI model training, accelerated insights
Challenges
Manual Data Extraction
Time-consuming and error-proneInconsistent Data
Data from SEC filings is inconsistently formatted and difficult to processData Preparation
Preparing data for AI training can be complex and time-consumingScalability Issues
Difficulty handling large volumes of dataImpact
Efficiency
Reduced manual workload, improved processing timesAccuracy
Improved data accuracy and consistencyScalability
Increased efficiency and scalability for handling large datasetsAI Model Performance
High-quality data can improve AI model performanceWrk Automation
Web Process Automation
pulls a list of the current S&P 500 companiesSEC EDGAR Filings API
retrieves each company’s latest 10-K documentHuman in the loop
meticulously extracts each individual risk factor found in each 10-K documentAI bots
summarize each individual risk factor section and convert to JSONGmail API
delivers the outputted JSON file to the client for upload into AI model
Success Stories from Our Clients

3000+ hours saved
MainMicro saves thousands of hours every month with Wrk's OCR + AI automation to streamline their accounts payable processes.

Jesse Fagen
VP Operations

150K new leads
Cision generates thousands of new leads by monitoring non-traditional data sources using automation uniquely developed on Wrk.

Nick Bhutani
Dir. Marketing

200K tax receipts
Penny Appeal automated the generation of over 200,000 tax receipts and orphan donor cards with Wrk's document automation.

Fawad Kalsi
CEO

Reduced processing times by over 50%
If you’re looking for a smarter way to scale your business and eliminate repetitive tasks, Wrk is a game-changer. It’s automation without the headaches.

Tim Nichols
Co-Founder
Success Stories from Our Clients
3000+ hours saved
MainMicro saves thousands of hours every month with Wrk's OCR + AI automation to streamline their accounts payable processes.
Jesse Fagen
VP Operations
150K new leads
Cision generates thousands of new leads by monitoring non-traditional data sources using automation uniquely developed on Wrk.
Nick Bhutani
Dir. Marketing
200K tax receipts
Penny Appeal automated the generation of over 200,000 tax receipts and orphan donor cards with Wrk's document automation.
Fawad Kalsi
CEO
Reduced processing times by over 50%
If you’re looking for a smarter way to scale your business and eliminate repetitive tasks, Wrk is a game-changer. It’s automation without the headaches.
Tim Nichols
Co-Founder
So what can you automate?
So what can you automate?
So what can you automate?
So what can you automate?
Sales Automation
Streamline your sales funnel by automating the manual and mundane, and extend it all out by connecting it directly to your CRM and sales tools.
List building & lead generation
Set up automated email sequences
Set up automated email sequences
Set up automated email sequences
Personalization LinkedIn and email campaigns
Set up automated email sequences
Set up automated email sequences
Set up automated email sequences
Pre-sales report generation with GenAI
Set up automated email sequences
Set up automated email sequences
Set up automated email sequences


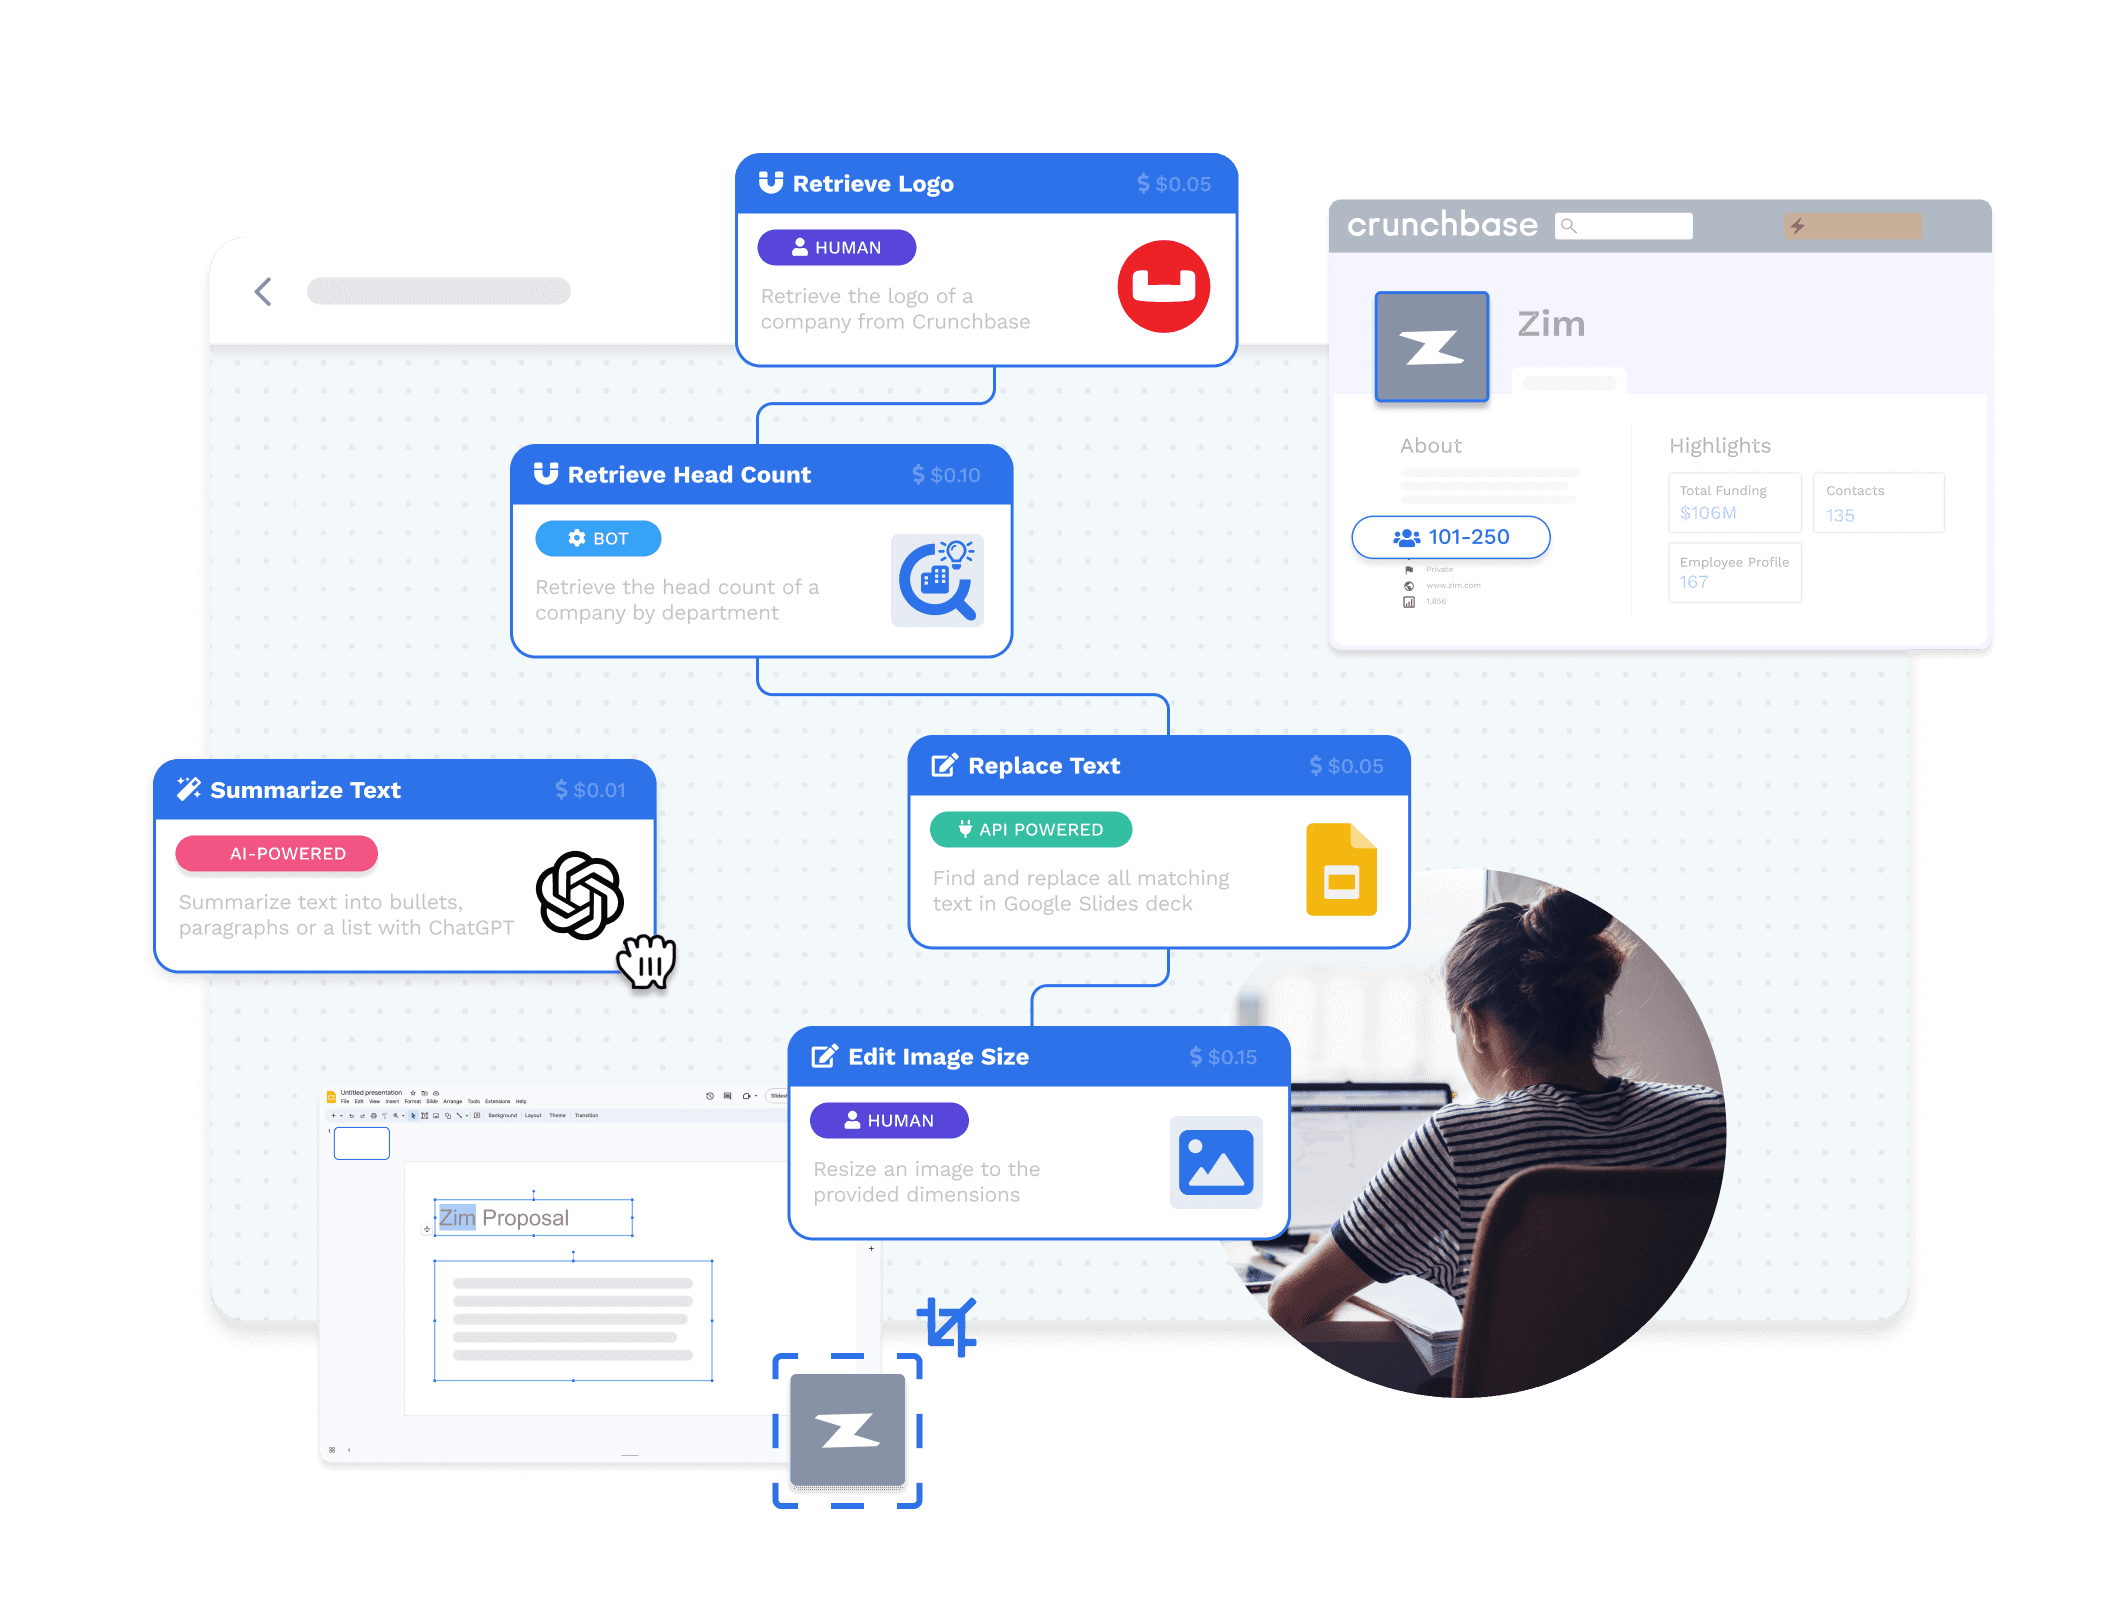
Marketing Automation
Connect all your marketing tools, enhance and enrich your data, but most importantly use bots to keep it all clean!
Hubspot & Salesforce automated contact cleanup
This helps you understand which marketing channels are driving the most leads.
This helps you understand which marketing channels are driving the most leads.
This helps you understand which marketing channels are driving the most leads.
Daily ChatGPT generated blog posts to wordpress
Prioritize leads and identify those that are most likely to convert into customers.
Prioritize leads and identify those that are most likely to convert into customers.
Prioritize leads and identify those that are most likely to convert into customers.
Automated lead enrichment with phone numbers & emails from Apollo.io
Set up automated email sequences
Set up automated email sequences
Set up automated email sequences
Finance Automation
Stop the insanity with all the accounts payables and receivables. Deploy reliable finance bots you can trust.
Invoice automation and reconciliation against purchase orders
In real-time, ensuring consistency and accuracy of customer information data.
In real-time, ensuring consistency and accuracy of customer information data.
In real-time, ensuring consistency and accuracy of customer information data.
Transaction synchronization across stripe, quickbooks or netsuite
With CRM integration, you can segment your email lists based on CRM data individual.
With CRM integration, you can segment your email lists based on CRM data individual.
With CRM integration, you can segment your email lists based on CRM data individual.
Daily accounts payable automated remidners for delinquent accounts
A lead clicks on a link in your email, a task can be generated in the Customer relationship management.
A lead clicks on a link in your email, a task can be generated in the Customer relationship management.
A lead clicks on a link in your email, a task can be generated in the Customer relationship management.

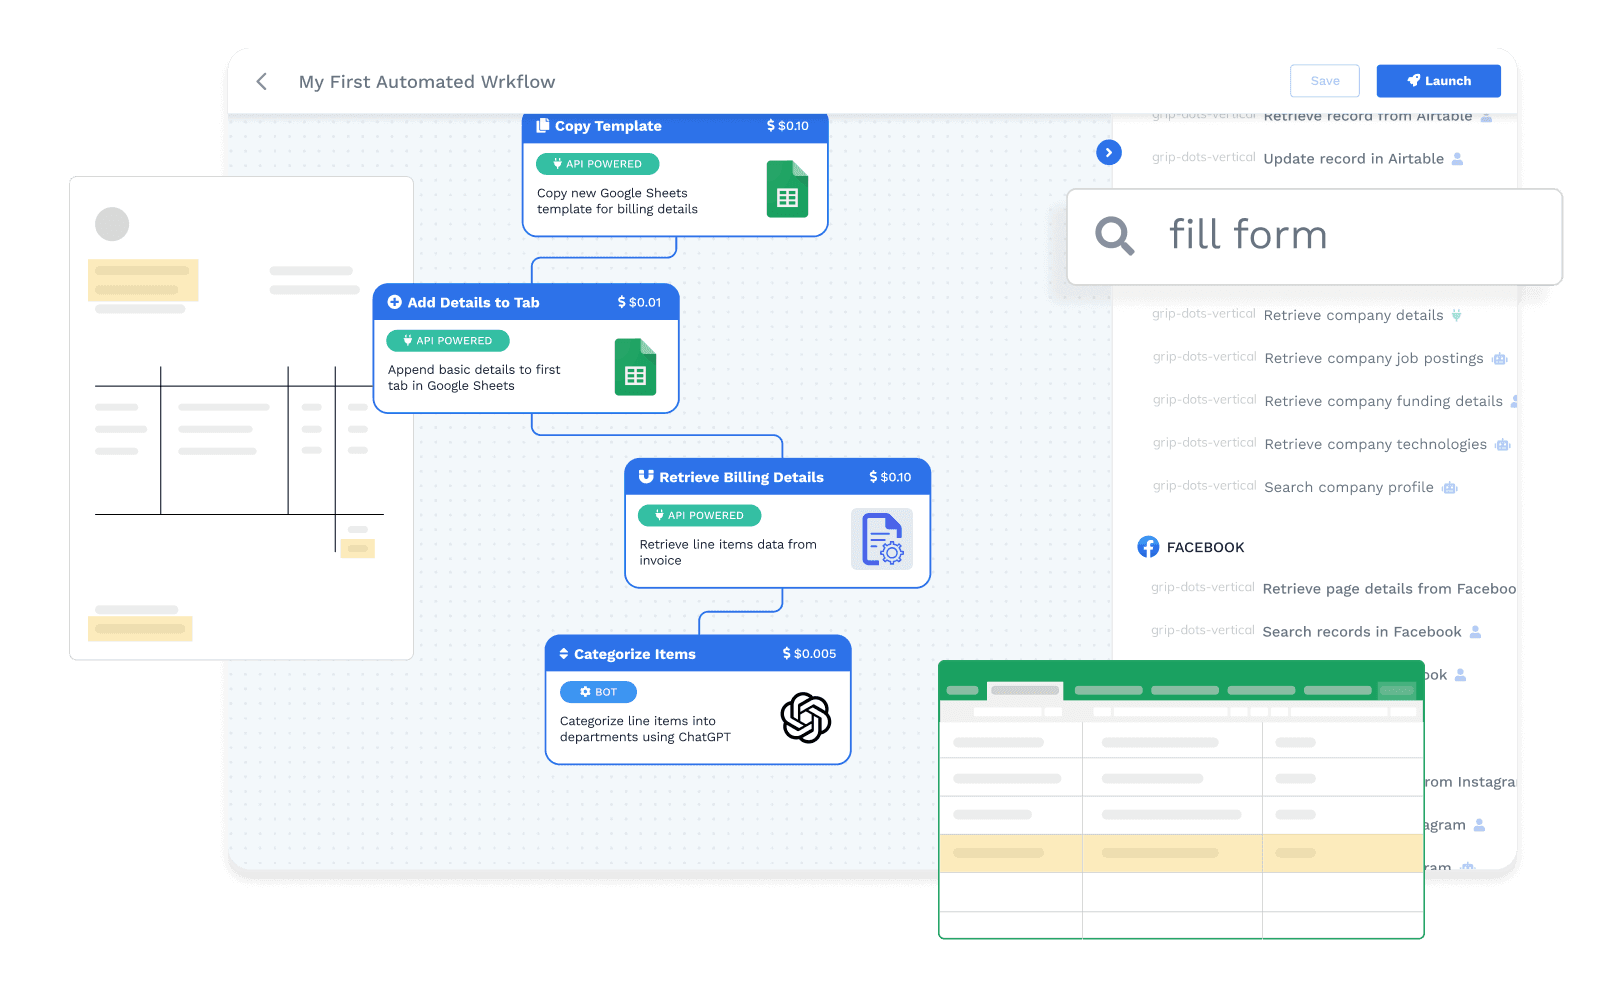
Browser & Desktop Automation
Scrape, crawl, fill forms, or point & click... Automate whatever your team is doing manually online or on a desktop.
Retrieve list of information on a website every 10 minutes
Publish posts across multiple social media platforms
Publish posts across multiple social media platforms
Publish posts across multiple social media platforms
Login and submit form on old archaic system
Social listening tools enable you to monitor conversations
Social listening tools enable you to monitor conversations
Social listening tools enable you to monitor conversations
Download call recordings from old version of citrix
Track the performance of your social media efforts.
Track the performance of your social media efforts.
Track the performance of your social media efforts.
Simple, Transparent Pricing
Simple, Transparent Pricing
Simple, Transparent Pricing
Simple, Transparent Pricing
One-Time Build Cost
We'll build your wrkflow for you with a one-time build cost for a wrkflow you'll own forever.
starting at
$1,000
What’s included
Dedicated automation developer
Automation design and development
Thorough automation testing and validation
Development of new Wrk Actions if required
Dedicated account manager
Bonus credits to get you started
If we cannot automate your process, we will give you a 100% refund
+
Consumption Credits
Pay per unit of work delivered by your wrkflow with never-expiring rollover monthy credits.
starting at
$250/month
What’s included
Fixed price per result. See examples →
Unused credits roll over month-to-month
Top-up any time time with more credits
Bonus credits starting at 4%
Chat & email customer support
Active monitoring of all workflows
No contracts. Cancel anytime!
Credits spending includes:
Running workflows & building new ones
Support to review workflow outcomes
QA service
Dedicated hosted AI server & secure data storage
Example Pricing*
Multi-platform data sync
$0.15 / data sync'd
CRM contact cleanup
$0.20 / phone + email cleanup
Document automation
$0.65 / document
PDF / Report Generation
$1.10 / report
*costs will vary based on each individual clients' needs
One-Time Build Cost
We'll build your wrkflow for you with a one-time build cost for a wrkflow you'll own forever.
starting at
$1,000
What’s included
Dedicated automation developer
Full testing & integration into your processes and systems
Thorough automation testing and validation
Development of new Wrk Actions if required
Dedicated account manager
Bonus credits to get you started
If we cannot automate your process, we will give you a 100% refund
+
Consumption Credits
Time to commit to a little more and put your automation on autopilot.
starting at
$250/month
What’s included
Fixed price per result. See examples →
Unused credits roll over month-to-month
Top-up any time time with more credits
Bonus credits starting at 4%
Chat & email customer support
Active monitoring of all workflows
No contracts. Cancel anytime!
Credits spending includes:
Running workflows & building new ones
Support to review workflow outcomes
QA service
Dedicated hosted AI server & secure data storage
Example Pricing*
Multi-platform data sync
$0.15 / data sync'd
CRM contact cleanup
$0.20 / phone + email cleanup
Document automation
$0.65 / document
PDF / Report Generation
$1.10 / report
*costs will vary based on each individual clients' needs
Don't want to wait?
Tell us what you want to automate and we'll send you a price right away
Start Automating with Wrk
Kickstart your automation journey with the Wrk all-in-one automation platform
ABout The Platform
Platform Features


Copyright © 2025 Wrk Technologies Inc. All Rights Reserved.

ABout The Platform
Platform Features
Copyright © 2024 Wrk Technologies Inc. All Rights Reserved.
ABout The Platform
Platform Features
Copyright © 2024 Wrk Technologies Inc. All Rights Reserved.
ABout The Platform
Platform Features
Copyright © 2024 Wrk Technologies Inc. All Rights Reserved.